
Looking for a graphic to illustrate a blog post you’re writing or a presentation you’re creating?
Peruse the archives at comScore Data Mine, a service that offers free statistical data in colorful charts and graphics. If you use one, you must credit the company.
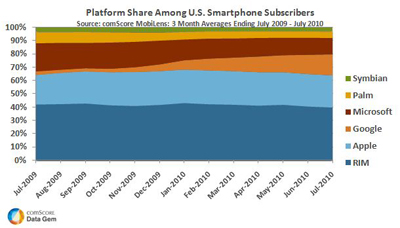
This is a new service, judging from the archives, so you won’t find a lot of topics from which to choose. But over time, this could be a valuable graphics tool. I found some nifty charts on the demographics of Facebook’s visitors, the Top 10 coupon sites, time spent online in Latin America and online travel spending in the United States.
Categories in the Archives
- Advertising Africa
- Middle East
- Asia
- Pacific
- Coupon
- E-Commerce
- Engagement
- Europe
- Latin America
- Mobile
- North America
- Online Video
- Search
- Social Networking
- U. S.
11 Ways to Use This Service
I know there are more, but I came up with 11 ways to use these graphics:
- At your website
- At your blog
- To illustrate a Note or as a photo to share on your Facebook Fan Page. (See 11 Ways to Avoid Missed Opportunities on Facebook.)
- In your online media room
- As part of a presentation you’re preparing
- In a book
- In a special report
- In a White Paper
- In a print or electronic newsletter
- To share with journalists
- To accompany a guest blog post you’ve written
You can also subscribe to their RSS feed or follow them on Twitter so you don’t miss a thing.
What have I missed? What other ways could Publicity Hounds use free graphics like these? Do you use any other free photo and graphics services?
Thanks Joan. Always appreciate learning about good sources of information. I’ll be using one of the graphs in a post on Thursday.
And as you know, one way to increase the odds of having blog posts tweeted and spread through social media is to have visual cues. Graphs, charts and diagrams are examples of visual cues. Video, colorful checklists or a quick survey/poll are more examples.
By the way, emarketer.com is another place to check for graphs in their articles and posts. The difference is that the site isn’t dedicated solely to graphs and charts like ComScore Data Mine is.
Joan,
Thanks so much for the great resource.
I always look forward to getting your tips. With an inbox that is overflowing with mail, I look for your newsletter to open first.
Until the next one . . . 🙂 Dana