I’m still playing around with free infographics tools and apps in preparation for my webinar tomorrow—Thursday, May 24—on How to Easily Create Free and Inexpensive Infographics.
You’d be amazed at the astonishing number of web-based tools, and reviewers, who refer to so many of these DIY graphics sites as “drop dead simple.” Not for my non-techie mind.
I abandoned Infogr.am, a site that a few reviewers were gushing over, when I tried repeatedly to load their template for a pie chart, but it kept loading something completely different.
OK, then. I chose another template and created a chart comparing the weight loss of three fictional women over a five-month period. When I got to the end of the project, about 45 minutes later, I lost all my work. Enough of that!
After doing a Google search for free infographics, I ended up at Piktochart.com and fell in love with this site! Everything is drag and drop. It’s easy to understand. The “undo” button, my best friend, is easy to locate. The only quibble I had was that I was unable to upload my logo or graphics. (Did I miss this somewhere?)
UPDATE on May 23: Piktochart tells me you can, indeed, upload your own logo or images. Go to Edit Info > Tools > First icon on the left.
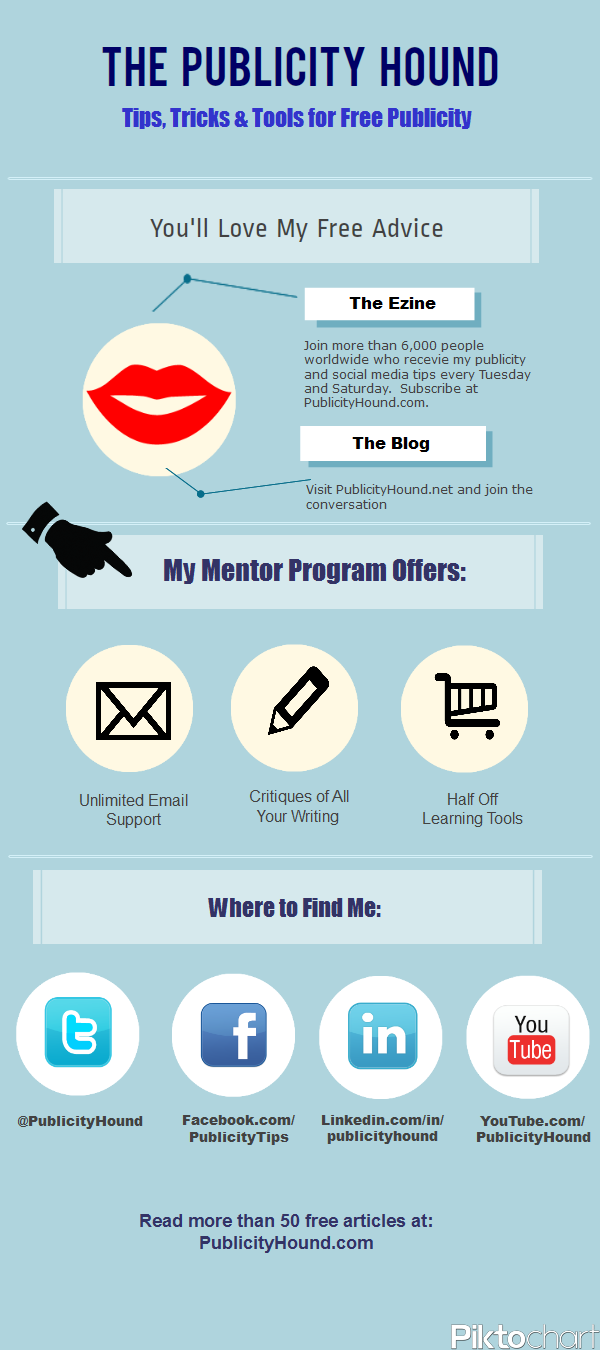
The infographic below took about two hours because I was super-picky about the fonts and colors. I chose one of their free templates rather than paying a monthly fee which would have given me a bigger selection of some gorgeous templates. I didn’t have time to research statistics to use when creating it, so I used information about my own business.
Also check out the other infographic I created earlier this week about 3 Questions Bloggers & Journalists Love using Easel.ly. If you want more time-saving tips about what to do, and not do, when you use these sites, register for Thursday’s infographics webinar here. I’m going to save you hours of time using these sites because I’ll tell you about all the mistakes I made.

Your infographic looks great, Joan. You’re saving me a ton of time since I’m working on a survey that we want to publish as an infographic. Thanks for sharing your experience with these tools.
Glad I can help, Denise. My best tip: Map out exactly what you want it to look like before you start using the online tool. And look through all the available templates and graphics before you start so you have a good idea of exactly what images are available. My second best tip: Periodically, save your work! Or lose it all like I did.
It’s like that old sewing adage, (or any craft that requires precision) ‘measure thrice – cut once’.
Yep. You really have to pay attention to what you’re doing. No TV on in the background. And absolutely no multi-tasking.
Thanks for sharing, Joan. I tried an infographic on visual.ly, but it was limited in templates. I’ll give piktochart a try!
Did you notice any templates on visual.ly other than the ones for Twitter and Facebook?
Nope, which pretty much limits you to Facebook and Twitter comparisons. It’s so limited I don’t even see why they rolled it out.
Greg, could it be that both you and I are missing something on this site? I have gotten recommendations from numerous people to check this out. I did. I see nothing that makes me want to stay. Let me know if you find something that allows people to create infographics either from scratch, or with templates, or with help from the site.
Hey, this is hot!
That’s what I thought, too.
thanks for sharing ,Joan. piktochart seems good(didnt tried yet but surely going to try it)..hope it work good but the problem with these online tools is they are not too much flexible..already suggest you corel draw..you must have a look on it..it is very much flexible tool and i love working on it, hope you too:)
You’re right. Many of these tools are not flexible, but I found Piktochart very flexible and was able to do pretty much anything I wanted in the graphic I showed you. The problem a lot of people have is that if they have the ability the ability to draw, they don’t have an artistic bone in their bodies (like me).
Hello
I tried Piktochart the free version but I cannot type in the black of the templates. Is there a certain way to do this? I thought you just type in the blank.
Not sure which template you are using. Yes, you can type text on a blank area. To do that, make sure #3 in upper left corner is activated. Then on left side, click on “Add Text.” You will have a choice of three kinds of text to add: a headline, a sub-head or small text. Click on the one you want and drag it onto the board. Then click on it and type.